This is a situation that arises often during classification machine learning. The target variable is categorical and the predictors can be either continuous or categorical, so when both of them are categorical, then the strength of the relationship between them can be measured using a Chi-square test.
Chi-square test finds the probability of a Null hypothesis(H0).
- Assumption(H0): The two columns are NOT related to each other
- Result of Chi-Sq Test: The Probability of H0 being True
- More information on ChiSq can be found here
It can help to understand whether both the categorical variables are correlated with each other or not.
In the below scenario, we try to measure the correlation between GENDER and LOAN_APPROVAL.
|
1 2 3 4 5 6 7 8 9 10 11 12 13 14 15 16 17 18 19 20 21 22 23 24 25 26 27 28 29 30 31 32 33 34 35 36 37 38 39 40 41 42 |
# Creating a sample data frame import pandas as pd ColumnNames=['CIBIL','AGE','GENDER' ,'SALARY', 'APPROVE_LOAN'] DataValues=[ [480, 28, 'M', 610000, 'Yes'], [480, 42, 'M',140000, 'No'], [480, 29, 'F',420000, 'No'], [490, 30, 'M',420000, 'No'], [500, 27, 'M',420000, 'No'], [510, 34, 'F',190000, 'No'], [550, 24, 'M',330000, 'Yes'], [560, 34, 'M',160000, 'Yes'], [560, 25, 'F',300000, 'Yes'], [570, 34, 'M',450000, 'Yes'], [590, 30, 'F',140000, 'Yes'], [600, 33, 'M',600000, 'Yes'], [600, 22, 'M',400000, 'Yes'], [600, 25, 'F',490000, 'Yes'], [610, 32, 'M',120000, 'Yes'], [630, 29, 'F',360000, 'Yes'], [630, 30, 'M',480000, 'Yes'], [660, 29, 'F',460000, 'Yes'], [700, 32, 'M',470000, 'Yes'], [740, 28, 'M',400000, 'Yes']] #Create the Data Frame LoanData=pd.DataFrame(data=DataValues,columns=ColumnNames) print(LoanData.head()) ######################################################### # Cross tabulation between GENDER and APPROVE_LOAN CrosstabResult=pd.crosstab(index=LoanData['GENDER'],columns=LoanData['APPROVE_LOAN']) print(CrosstabResult) # importing the required function from scipy.stats import chi2_contingency # Performing Chi-sq test ChiSqResult = chi2_contingency(CrosstabResult) # P-Value is the Probability of H0 being True # If P-Value>0.05 then only we Accept the assumption(H0) print('The P-Value of the ChiSq Test is:', ChiSqResult[1]) |
Sample Output:
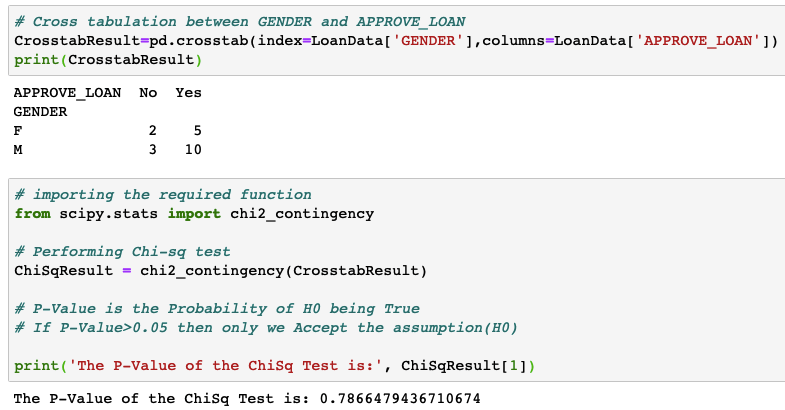
H0: The variables are not correlated with each other. This is the H0 used in the Chi-square test.
In the above example, the P-value came higher than 0.05. Hence H0 will be accepted. Which means the variables are not correlated with each other.
This means, if two variables are correlated, then the P-value will come very close to zero.

How to decide what will be H0? The variables are not correlated with each other or The variables are correlated with each other.
Hi Trapti
For Chi-sq test, H0 is always same: “the variables are NOT correlated”
if p_value is 0. Can we consider that feature.
Hi Shital,
If P-value is 0, you can select the feature. this is because P-value=0 means the H0 is false, Hence variables are correlated!
Regards,
Farukh Hashmi
Hello, can you please explain what the test does to understand if there is a correlation between the categorical variables (from a computational point of view)?