Pandas is one of the most widely used libraries in python for all data import/export, manipulation, exploration, and data wrangling tasks.
There are two data structures in Pandas which are important.
- Pandas Series
- Pandas DataFrames
Pandas Series
Pandas Series can be imagined as one single column in data. You can create it using the Series() function in Pandas.
A Pandas series can contain data which is numeric as well as character or both.
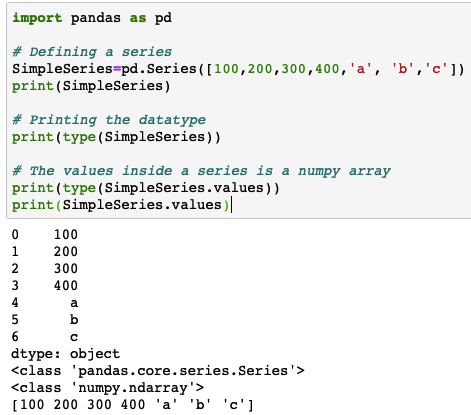
Below code snippet shows how to define a pandas series. Note that, we have imported pandas as ‘pd’. It means now we can access all pandas functions using pd.
Once you create a pandas series and print it, you can see row indexes getting assigned automatically. It is representing a single column.
If you extract only the values of a series using the .values command, then it will fetch just a numpy array as shown in the last command.
|
1 2 3 4 5 6 7 8 9 10 11 12 13 |
# importing the pandas library with alias pd import pandas as pd # Defining a series SimpleSeries=pd.Series([100,200,300,400,'a', 'b','c']) print(SimpleSeries) # Printing the datatype print(type(SimpleSeries)) # The values inside a series is a numpy array print(type(SimpleSeries.values)) print(SimpleSeries.values) |
Sample Output:
Different ways to create Pandas Series are shown below
|
1 2 3 4 5 6 7 8 9 |
# Creating a character series CharSeries=pd.Series(['a','b','c','d']) print(CharSeries) # Creating a numeric series print(pd.Series([20,3,4,22,7])) # Creating a series using range function print(pd.Series(range(1,10))) |
Sample Output:

Pandas DataFrame
Pandas DataFrames are the representation of rows and columns of data. The data which is present in a csv file, excel file, database table etc, when you read it using pandas, it is stored as a DataFrame.
You can manually create a data frame using the DataFrame() function in Pandas.
The input to DataFrame() function is a list of lists as shown below. It can be a tuple of lists or a list of tuples also. The bottomline is, the data must be passed as a 2-D object, hence, it will represent rows and columns.
|
1 2 3 4 5 6 |
# DataFrame function expects input data in 2-D format SampleData= [[10,'value1'], [20,'value2'], [30,'value3']] SimpleDataFrame=pd.DataFrame(data=SampleData, columns=['Col1','Col2']) print(SimpleDataFrame) |
Sample Output:

You can add a new row to this data frame using the append() function. Or add a new column by specifying the column name and passing the values for that column. Apart from this, there are many more useful commands for DataFrames which you can check in Data Manipulation section.
|
1 2 3 4 5 6 7 8 9 |
# Adding new row to the data frame NewRow=pd.DataFrame(data=[[40,'value4']], columns=['Col1','Col2']) SimpleDataFrame=SimpleDataFrame.append(NewRow, ignore_index=True) print(SimpleDataFrame) # Adding new column to the data frame SimpleDataFrame['Col4']=[100,200,300,400] print(SimpleDataFrame) |
Sample Output:

