
Standard Deviation helps to understand ‘On an average, how far away each data point is from the mean value’
Let us take a very simple example to understand what exactly the standard deviation means.
Consider the first six numbers shown below.
Mean of these numbers will be (1+2+3+4+5+6)/6 = 3.5
Now, S
Standard deviation tells me, on an average how far each of these numbers is from the mean value.
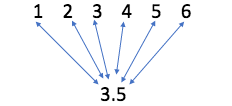
let’s calculate the distance of each number from the mean
Distance of 1 from mean = 1 – 3.5
Distance of 2 from mean = 2 – 3.5
Distance of 3 from mean = 2 – 3.5
So on and so forth…
Now the average distance will be the sum of all the distances divided by six as shown below.
However, if you take a close look into this expression, it evaluates to zero because of
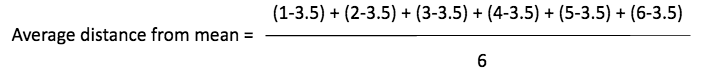
Hence, if we square the differences, each value becomes positive and it gives us the ‘on an average squared distance of each number from the mean. This is also known as the Variance.
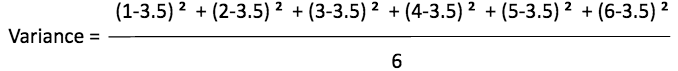
Variance tells you, what is the on an average squared distance of each value from the mean
But, our
Standard deviation is the square root of the variance
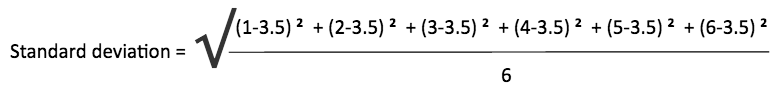
Standard deviation is also abbreviated as ‘std dev’. Take a look below at the std dev formula using our existing example.
|
1 2 3 4 5 |
# Example by considering first six numbers Numbers: 1, 2, 3, 4, 5, 6 Mean: 3.5 Variance: 3.5 Standard Deviation: 1.87 |
Hence, for the first six numbers, we get to understand that on an average each number is 1.87 units far away from mean value 3.5.
How do I use it for my analysis?
Low standard deviation means the data points are close to each other and do not vary much.
High standard deviation suggests either the data points are scattered or there are extremely low or extremely high values present in the data sets also known as outliers.
The same is the case for the variance. Low variance means the data points are close to each other and high variance means there are values that are far away from each other. You might have often heard the term “high variance” and “low variance” in stock markets. A stock with high variance means its price fluctuates a lot and it might be a small-cap stock. Investing in such stocks could be risky.
What is the ideal value of the standard deviation?
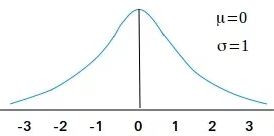
Ideally, the standard deviation should be 1. This is true for the hypothetical standard normal distribution where the mean value is zero and the standard deviation is 1.
High standard deviation example #1
Outliers increase standard deviation and variance both. This happens because the outlier will pull the mean value towards it and as a result, every value will be far away from the mean.
|
1 2 3 4 5 |
# Example by considering first five numbers with an outlier Numbers: 1, 2, 3, 4, 5, 600 Mean: 102.5 Variance: 59403.5 Standard Deviation: 243.72 |
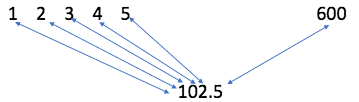
Outliers increase the value of standard deviation
High standard deviation example #2
Another way when standard deviation will go high is because of scattered values.
A simple way to recognize this is to see if the values are far away from each other. In such case, the mean value will be far away from most of the values and hence the on an average distance will increase.
|
1 2 3 4 5 |
# Example by considering scattered numbers Numbers: 10,100,500,2000,730 Mean: 668 Variance: 640470 Standard Deviation: 800.29 |
Data Science Tip: How to use standard deviation?
- Data exploration: If the standard deviation of a feature/column is high, check for outliers in the data by looking at its distribution. Use the histogram to visualize the distribution.
- Feature selection: High standard deviation for a feature/column suggests biased distribution and may not be useful without treatment.
- During model fitting: If the standard deviation of residuals is high, check for possible outliers/business anomalies in training data.
- During Predictions: If the standard deviation is high for errors that means the predictions are wrong at many places.
Conclusion:
- Standard deviation tells me, on an average how far each of these numbers is from the mean value.
- Standard deviation is the square root of the variance
- Ideally, the standard deviation should be 1
- Outliers increase the value of the standard deviation
